All I Really Need for Data Analysis I Didn't Learned in Kindergarten — Non-Standard Stats and Statistical Schadenfreude
One of the fun things about reading scientific articles is seeing all of the ways that non-statisticians handle statistical questions1. I'll try not to be too quick to cast aspersions on the scientists: they're busy focusing on their science, and haven't taken much time to bone up on any statistics past the most introductory stuff2.
The real schadenfreude comes from a statistical analysis that seems reasonable on first blush, but that gives a wonky answer. The most recent example comes from a paper exploring statistical patterns in the communication behavior of individuals on Twitter. This work interested me due to its obvious connections to some work I've done.
The authors of this paper ask an interesting question: can we identify a statistical law that governs the time between tweets for users on Twitter? And if we can, can that law be used to distinguish between the accounts of regular users, corporations, and bots? Despite seeing power laws where there probably are none3, the authors do find that the statistical properties of the interarrival times of tweets have predictive power.
The strangeness occurs when the authors go about estimating the distribution of interarrival (or 'intertweet,' if we're feeling cheeky) times. The data, while continuous in reality comes binned (to the nearest second), already distorting the distribution we'd like to learn. The authors further distort (a kinder phrasing would be 'process') the data by further binning the raw data into log epochs. They then use a histogram estimator for the density, but use cubic spline interpolation to get values of the density between the discretized points.
Let's see what this looks like with a single realization of 100 normal4 random variates:
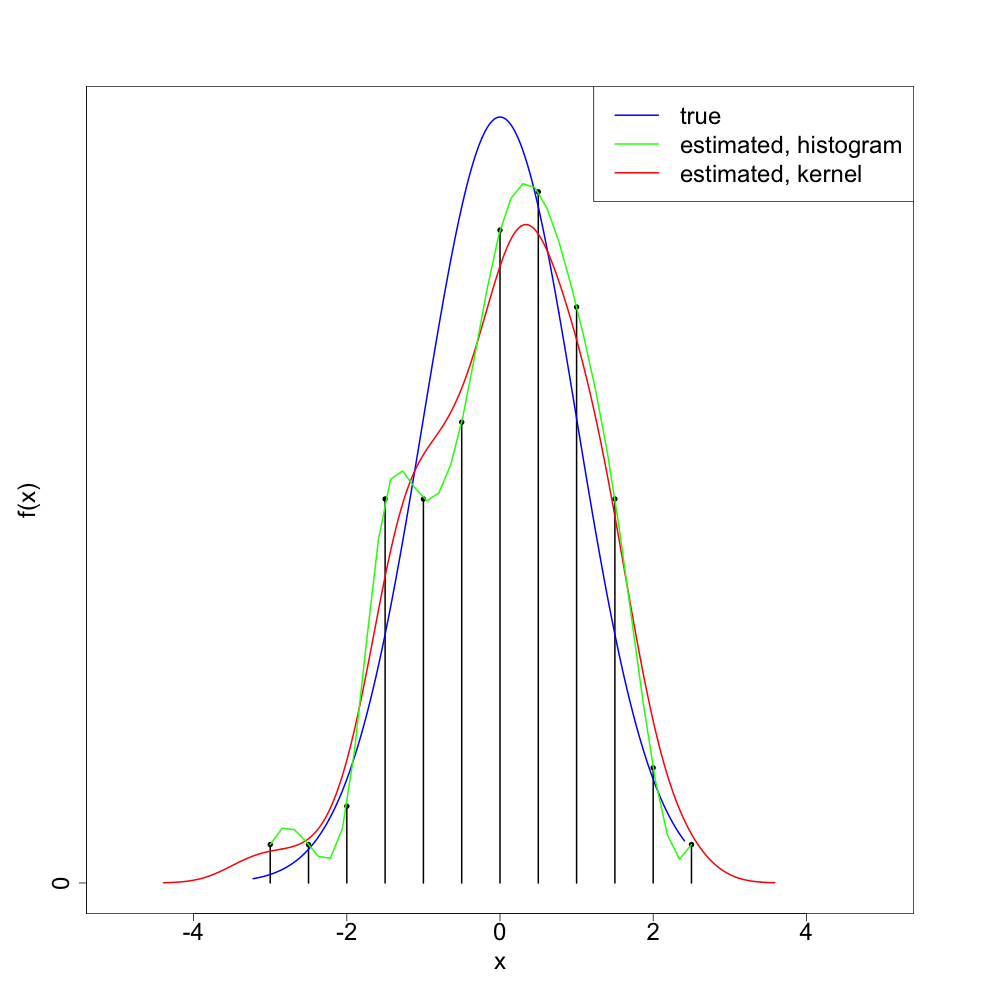
As we can see, the 'splined histogram' tends to give a more variable (too 'wiggly') density estimator than the standard kernel density estimation method. I think (though will not prove) that the splined histogram approach is consistent5, at least as long as we take the bin width to zero in a way depending on the sample size.
But the point is that we did a lot of extra work that only bought us a worse method. Kernel density estimation achieves the minimax risk up to a multiplicative constant, so we can't do much better with any non-parametric density estimation method. And there's no evidence this method should outperform the kernel density estimator's constant6.
One of the hallmarks of good science is asking interesting questions. The authors of this paper certainly do that. They could just use a bit more education in basic statistical inference7.
Similar in vein to finding clinicians who 'discover' the trapezoid rule.↩
Despite the existence of wonderful books that cover (almost) all of statistics.↩
Doing a similar analysis on my Twitter data, I found that the authors have probably made baby Gauss cry. In short, if you look at the tail of a log normal distribution, you can find something that looks very much like a power law, even when there is none.↩
As noted in the footnote above, the data are actually closer to log normal. But we can get back and forth between these two by exponentiating / logging, so I'll stick to the normal distribution since it's easier to visualize.↩
In the statistical sense. That is, in the limit of infinite data, it converges in probability to the true density of the data generating process.↩
I just realized that we could perhaps do cleverer things with this method. For example, instead of fixing the discretization, we could learn it adaptively using log-likelihood cross-validation. (The authors don't do this.) But this adds unnecessary bells and whistles to a junky car.↩
One of the reasons I sometimes bristle at the new phrase 'data science.' Data science seems to me, as an outsider, like statistics / computer science without the rigor. It need not be this. But that seems to be the direction it's currently heading.↩