Lines, Springs, and Statistical Thinking
Attention Conservation Notice: A lesson that you can use any statistical method you want, but some are certainly better than others.
I follow Rhet Allain's blog Dot Physics. In fact, his most recent post about replacing the terms 'hypothesis', 'theory', and 'scientific law' with 'model' in the scientific lexicon is spot on. That's something I feel extremely comfortable with as a mathematician: 'most models are wrong, some are useful.'
But another recent post of his, about finding the spring constant for a spring-mass system made my ears perk up. In high school and college, my favorite part of labs was always the data analysis (and my least favorite part was the labwork, which goes a long way towards explaining why I'm now training to be a mathematician / statistician).
With the briefest of introductions, the model for a spring-mass system (without drag) falls out of the linear, second-order, constant coefficient ordinary differential equation1
\[m y'' + ky = 0\]
where \(y\) is the displacement of the spring away from its equilibrium position, \(m\) is the mass on the spring, and \(k\) is the spring constant. This follows directly from Hooke's law2, namely that the force acting on the mass is proportional to the negative of the displacement away from the equilibrium position, with the proportionality tied up in this thing we call the spring constant \(k\). From this alone we can derive the equation that we're interested in, namely the relationship between the period of a spring's oscillation and the spring constant. Skipping over those details, we get that
\[T = \frac{2 \pi}{\sqrt{k}} \sqrt{m}.\]
The usual lab that any self-respecting student of the sciences has performed is to place various different masses on the spring, displace the mass a bit from its equilibrium position, and measure its period (hopefully over a few cycles). Once you have a few values \((m_{1}, T_{1}), \ldots, (m_{n}, T_{n})\), you can then go about trying to find the spring constant. Doing so is of course a matter of regression, which brings us into wheelhouse of statistics.
And since we're in statistics land, let's write down a more realistic model. In particular. the thing that is being measured (and by undergraduates, even!) is the period as a function of the mass. Undergraduates are a fickle lot, with better things to think about then verifying a 350+ year old law. Their attention may waver. Their reaction speed may be lacking. Not to mention physical variations in the measurement system. All of this to say that the model we really3 have is
\[T_{i} = \frac{2 \pi}{\sqrt{k}} \sqrt{m_{i}} + \epsilon_{i}\]
where \(\epsilon_{i}\) is an additive error which, for the sake of simplicity, we'll assume has mean zero and variance \(\sigma^{2}\) not depending on \(m\). We'll also assume the errors are uncorrelated. This isn't so unreasonable of a model, compared to some of the probabilistic models out there.
As written, it seems obvious what we should do4. Namely, the model for \(T\) is linear in \(\sqrt{m}\), and we know the values of the \(m_{i}\) (to pretty high precision, if I recall correctly from my college physics days). On top of that, the Gauss-Markov theorem tells us linear regression is the best we can do to find the spring constant (out of the class of all unbiased estimators for it). So we should fit a linear regression of \(T\) against \(\sqrt{m}\), and read off \(k\) by simple algebra.
Allain takes a different tact, which at first seems just as good. Namely, he notices that if we square both sides of
\[T = \frac{2 \pi}{\sqrt{k}} \sqrt{m},\]
we get
\[T^{2} = \frac{(2 \pi)^{2}}{k} m,\]
which is now linear in \(T^{2}\) and \(m\). We can fit a line through the points \((m_{i}, T_{i}^{2})\) just as we would have with my method, and read off \(k\) in a similar fashion. But the problem with this approach is that the model isn't right. Remember, the actual model has error in it,
\[T_{i} = \frac{2 \pi}{\sqrt{k}} \sqrt{m_{i}} + \epsilon_{i},\]
so when we square the period, we get
\[T_{i}^{2} = \frac{(2 \pi)^2}{k} m_{i} + 2 \frac{2 \pi}{\sqrt{k}} \sqrt{m_{i}} \epsilon_{i} + \epsilon^{2}_{i}.\]
This is much uglier. And adds a bias to our model. In particular, note that
\[E[T_{i}^{2}] = \frac{(2 \pi)^2}{k} m_{i} + E[\epsilon^{2}_{i}] = \frac{(2 \pi)^2}{k} m_{i} + \sigma^{2}.\]
So as we add more measurement noise, we'll get more and more biased from the true value of the spring constant5.
This is a lot of math to say what every experimentalist already knows: when dealing with propagation of errors, it's best to manipulate the thing that has the least amount of error in it. In this case, that means taking the square root of the mass instead of squaring the period.
Theory is nice, but let's follow Allain's lead and do some simulations. I'll take the true value of the spring constant to be \(k = 13.5\), as Allain does in his post. I simulate from the model
\[T_{i} = \frac{2 \pi}{\sqrt{k}} \sqrt{m_{i}} + \epsilon_{i},\]
for each value of \(m_{i}\), and do this \(B = 10000\) times6,7. I took \(\epsilon_{i} \sim N(0, \sigma^{2})\), with various different values for \(\sigma\). Allain initially took his \(\epsilon_{i}\) to be Uniform(-1/20, 1/20), so I used that to get an equivalent variance for the normal case, namely \(\sigma = \sqrt{1200} \approx 0.03\). Below I've plotted both what the noisy data looks like (with the true regression curve in red), and the distribution of our different estimators over the 10000 trials.
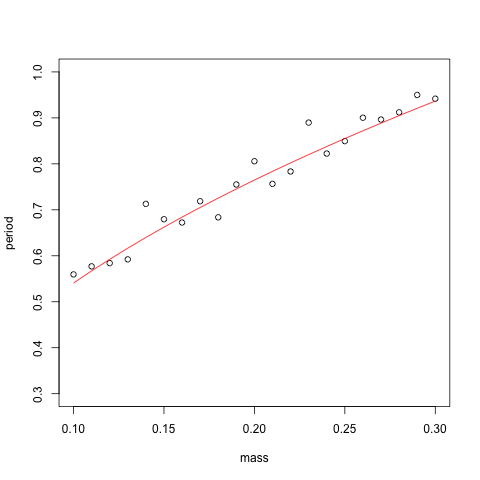
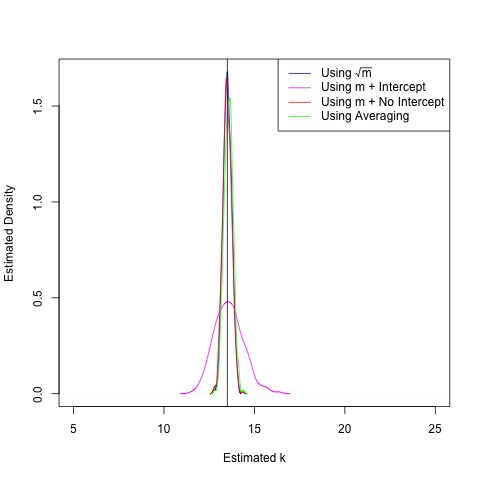
In the presence of low noise, all but the method that estimates both an intercept and a slope do about equally well8. This is good to know. But we would like our methods to continue to work well in the case of large amounts of noise. I can't stress this enough: these experiments are being performed by undergraduates!
So, let's bump up the noise to \(\sigma = 0.1\). This means that 95% of the time, the noise will only push us away from the true period by a magnitude of 0.2 seconds. That's doesn't seem like an unreasonable amount of uncertainty to allow in our period recording procedure. And here's the result:
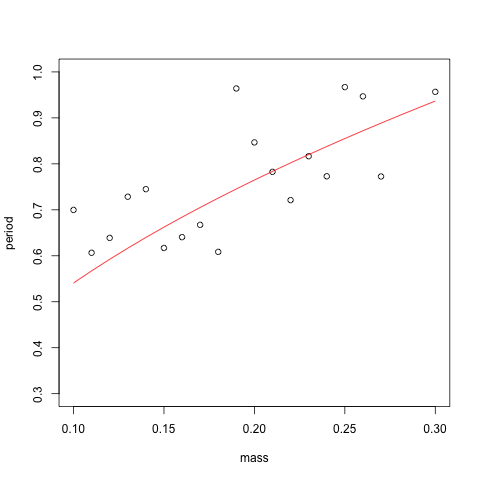
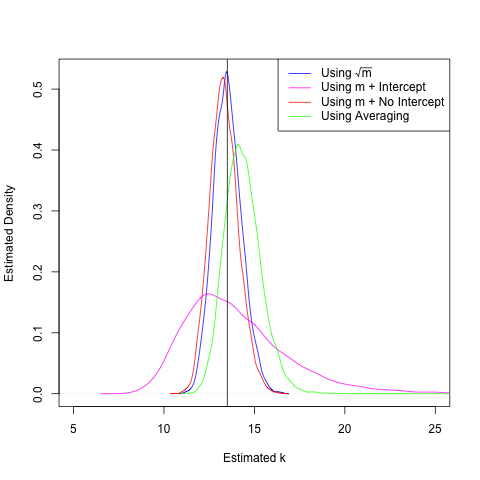
We can already see the bias creeping into our \(T^2\)-based estimators. Only the regression method using \(\sqrt{m}\) gives a density sharply peaked around the true value. This is unsurprising, given our analysis above, but also comforting. Finally, let's take the noise to an even greater extreme and use \(\sigma = 0.5\). This means that 95% of the time, we'll be off by at most a second from the true value of the period. This is an unreasonable amount of noise (unless the undergraduate performing the lab has had a particularly bad day), but it demonstrates the strengths and weaknesses of the various estimators for \(k\).
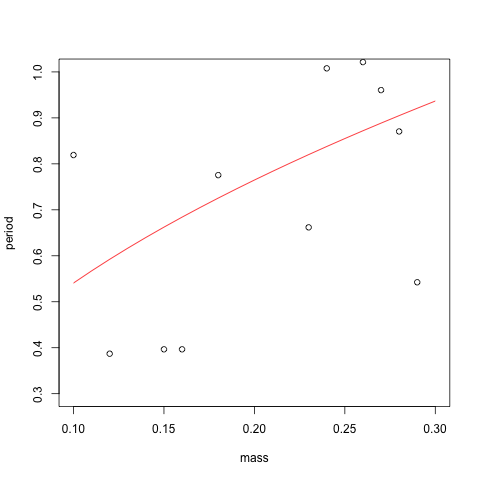
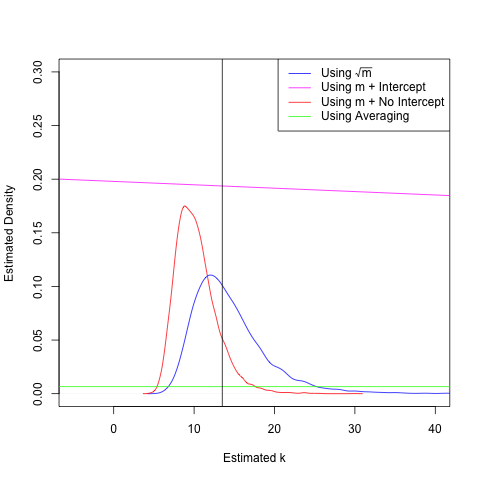
At this point, the densities need no explanation. Of the methods proposed in Allain's post, only the '\(m +\) No Intercept' method stills stays in the right ballpark of the true value of \(k\), but is biased by the squaring procedure. I can't stress enough that this amount of noise is unreasonable, especially since the students are presumably measuring the period over several oscillations and thus have the Law of Large Numbers on their side. But it does demonstrate the importance of thinking carefully (and statistically!) about how we would like to do our data analysis.
I have fond memories from my undergraduate days of manipulating equations until they were linear in the appropriate variables, and then fitting a line through them to extract some sort of physical quantity. At the time of that training, I had no statistical sophistication whatsoever. Understandably so. There's barely enough time to cover the science in standard science courses. But it would be nice (for both theorists- and experimentalists-in-training) if a little more statistical thinking made it into the curriculum.
For the sake of reproducibility, I have made my R code available here.
Can you tell I've TAed Elementary Differential Equations twice at UMD?↩
To have lived when you could have such a simple law named after you!↩
Not in the ontological sense, but rather in the sense of being more useful.↩
Though 'obvious' is a loaded word. I've been spending too much time thinking about regression, in all its various forms, lately.↩
Unless we add an (artificial) intercept to our regression model. The nice thing about (simple) physical models: we have reasons to include / not include parameters in our regression.↩
Simulation is a wonderful thing. And we've come a long way since when statisticians had to flip coins to get statistical fodder. I read a story once about Eugen Slutsky's study of apparent cycles in economic data. In the process of performing his simulations, he really did flip a coin thousands of times to simulate a random walk. Unfortunately, I can't find the article where I originally read this, so I'll just state it as a anecdote and hope I'm not misremembering.↩
You'll also notice that I took my masses (called 'design points' in the jargon of regression) to be at more regularly spaced intervals. Namely, I took them to be from 0.2 to 0.3, with spacing 0.01. This seems like a reasonable enough choice of masses, though again, asking our undergraduate to measure 21 periods may be a bit much. Besides, we certainly won't do better with less design points than this.↩
The degradation in performance for the '\(m +\) Intercept' model can be explained in terms of the well-known bias-variance tradeoff. But adding the intercept term to our squared period model, we've allowed the slope to be estimated correctly (by capturing the \(\sigma^{2}\) term within the intercept), thus reducing the bias. But by forcing our procedure to estimate two quantities, we've increased the variance in both. In other words: if physics tells us to use a simpler model, for heaven's sake, use the simpler model!↩